


Budget
Budget Archive

Planning the City’s biennial budget
This page provides information to help you understand how the City budget works, where revenue comes from, how it is allocated, and other helpful resources as we move through the process.
Every two years, the City develops a budget that aligns resources with the goals, priorities, and vision established by the City Council. Under the City Charter, the City Manager prepares and recommends both the operating budget and the capital improvement program budget for City Council review and adoption.
Budget Schedule
The City’s biennial budget is reviewed by City Council in a series of public workshops and a public hearing. The schedule is as follows:
- April 27 – Budget Foundation and Forecast Workshop
- May 6 – Revenue Options Workshop
- June 10 – Revenue Strategy and Direction Workshop
- June 12 – 21 – Biennial Citizen Survey Open
- Aug 24 – Budget Workshop – Financial Policies and Investment Policy Workshop & Biennial Budget Update
- Sept 16 – Community Meeting – Get Involved in the City Budget Process
- Sept 21 – Budget Workshop – Preview of City Manager Recommended Budget
- Oct 1 – City Manager Recommended Budget Published
- Oct 12 – Operating Budget Workshop
- Oct 26 – Capital Budget Workshop
- Nov 2 – Budget Workshop
- Nov 9 – 1st Reading – Biennial Budget
- Nov 16 – Public Hearing and Adoption of Biennial Budget
How public dollars become public services
Every day in our community, public dollars are at work. These dollars keep emergency responders ready, parks open, water safe, streets maintained, the local economy supported, the environment protected, and much more.
These services are supported by the revenue the City receives each year. That funding comes from several sources, and each one plays a specific role in maintaining daily operations and supporting long-term community needs. Some dollars can be used for a wide range of services, while other funds are legally restricted for particular purposes.
Quick guide to City funds
People often wonder why the City can’t move dollars around as priorities or needs change. The City uses fund accounting to manage the taxes and revenue we receive to provide municipal services. Think of each fund as a separate bank account with its own rules, revenue sources, and approved uses. Each fund falls into two main categories: restricted and unrestricted.
Unrestricted funds: do not have a dedicated funding source or legal obligation (property tax, local sales tax, utility taxes, business and occupation taxes, etc.)
Restricted funds: have a dedicated funding source and legal obligations (grants, lodging taxes, gas tax, fees for service, admissions tax, cultural access sales tax, etc.)
The City has 75 different funds to safeguard that these resources are used in the right way. Here’s a breakdown of some of the most common funds you’ll hear about during the budget process.
General Fund
These are unrestricted funds and are the most flexible funds the City has. It is the City’s main operating fund and is used for Police, Parks & Rec, Legal, City Admin, General Services, etc.
Special Revenue Funds
These are restricted funds and can only be used for specific purposes. A few examples include the Opioid Settlement Fund, the Cultural Arts Tax Fund, and the Business and Occupation Tax.
Capital Project Funds
These are usually restricted funds used for major construction and infrastructure projects like new fire stations, road reconstruction, park improvements, and water system expansions.
Enterprise Funds
These operate like businesses and are supported primarily by user fees, with customers paying rates or fees that fund their operations. They are generally restricted funds. Examples include the Water Utility, Sewer Utility, Stormwater Utility, and Pearson Field.
Internal Service Funds
City departments are charged for the services they use from Human Resources, IT, Communications, Finance, etc., and the funds are unrestricted.
What supports the General Fund
The City has three primary sources of revenue that support the General Fund: property tax, sales tax, and utility tax.
Property Tax
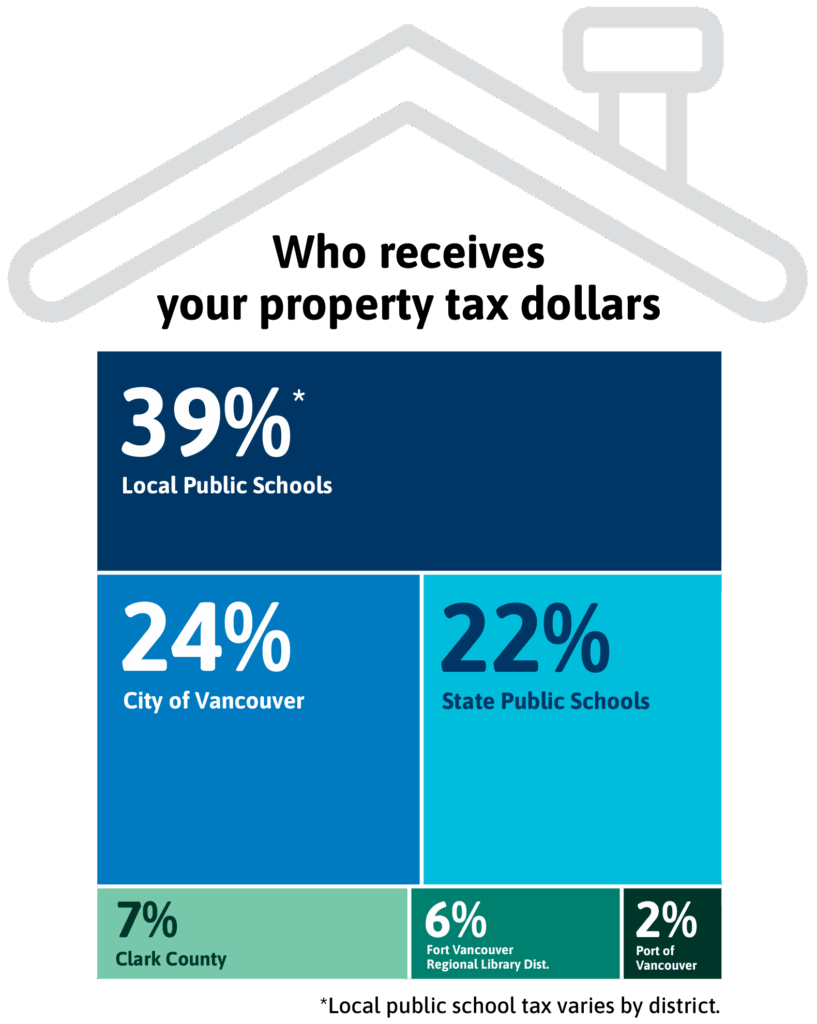
The City receives about 24 cents of every property tax dollar, which may surprise many people when they see the breakdown. In 2025, $78.1 million in property tax was collected. Most of the money on your tax bill goes to other public agencies that keep the region running. Each entity sets its own funding levels within the Washington state annual property tax growth limit. Your total bill is the sum of all those separate decisions.
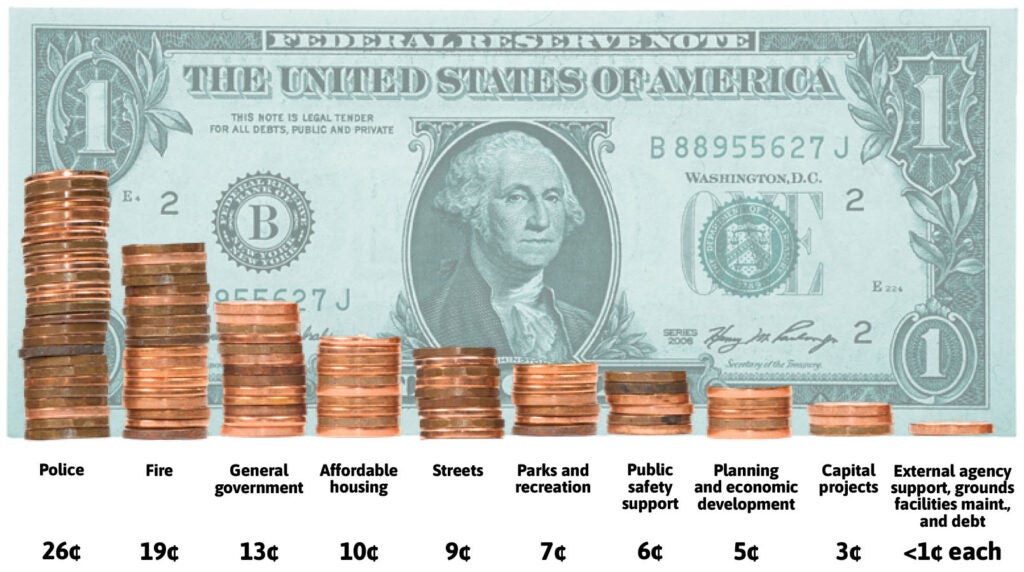
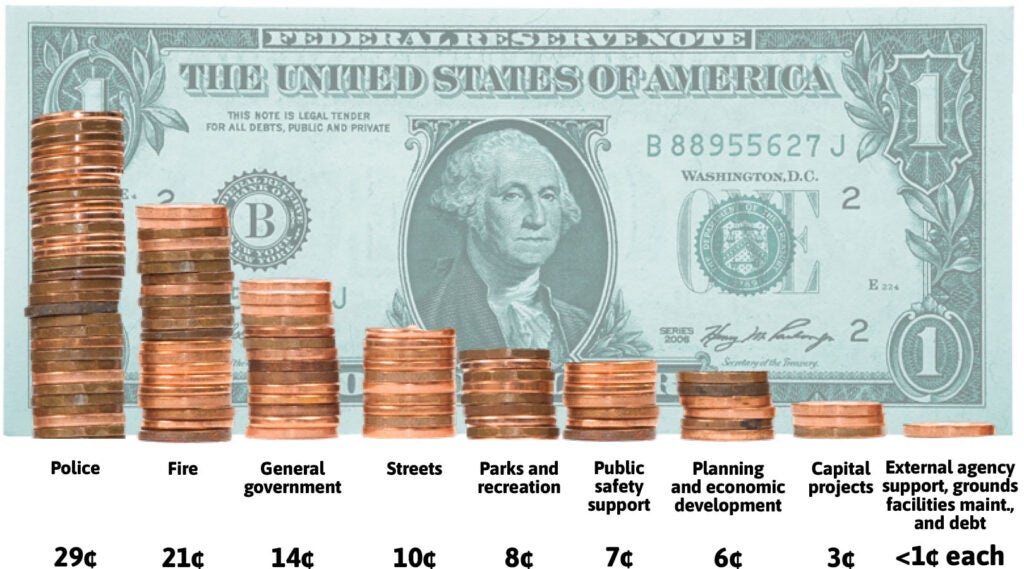
How the City invests one dollar of property tax
Sales Tax
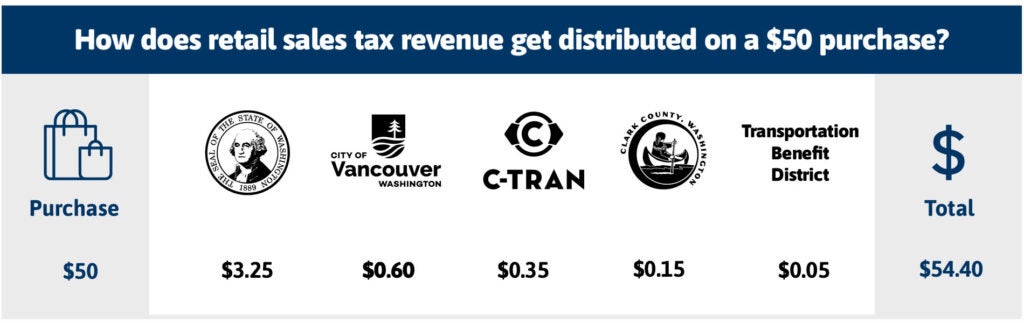
Retail sales tax in Vancouver consists of rates set by different governments. The state sets the largest share, and Clark County, the City of Vancouver, and regional agencies like C-TRAN can add their own voter-approved or state-authorized local taxes. All of these parts are added together to create Vancouver’s current retail sales tax rate of 8.8 percent. In 2025, $67.6 million in sales tax was collected.
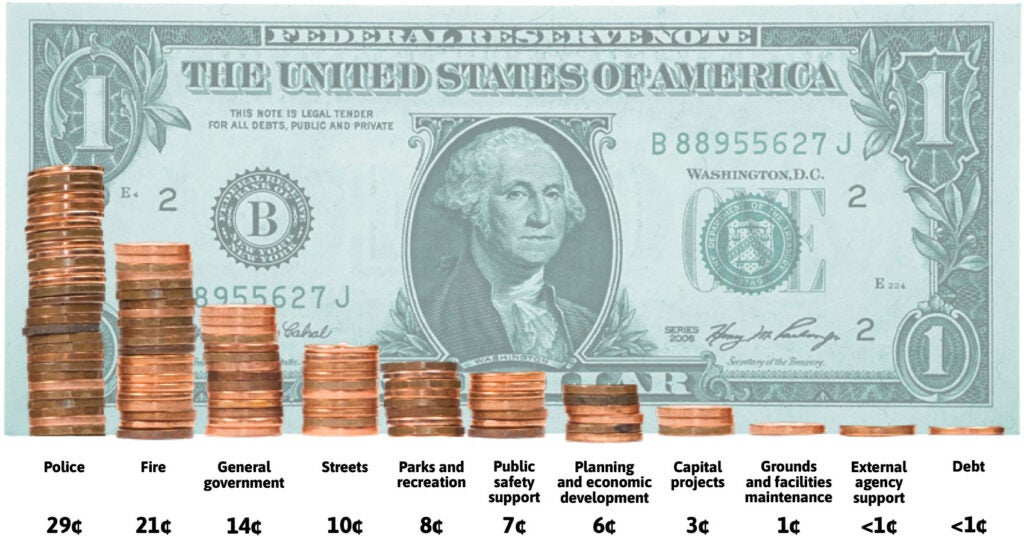
How the City invests one dollar of sales tax
Utility Tax
Utility taxes are a major source of revenue the City uses to pay for everyday services. These utility taxes are collected on water, sewer, stormwater, and other utility revenue, which help support police, fire, streets, parks, and other basic services. In 2025, $59.46 million in utility tax revenue was collected.
How the City invests one dollar of utility tax
Other sources of revenue
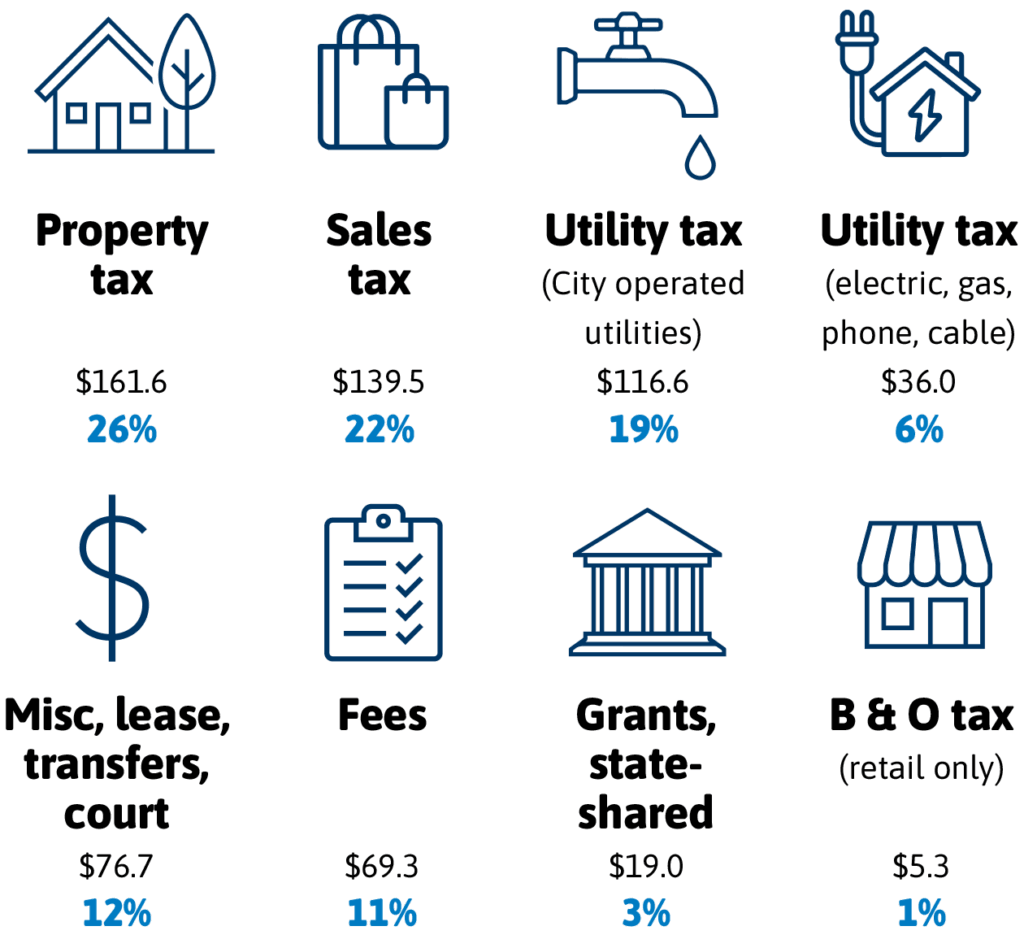
In addition to Property, Sales, and Utility taxes, the City has other sources of revenue, such as service fees, grants, and other taxes like the Business and Occupation Tax, the Admissions tax, and others.
Adopted 2025-26 Budget for General, Street, Fire Fund
(in millions; excludes one-time transfers)
Understanding the recurring budget deficit
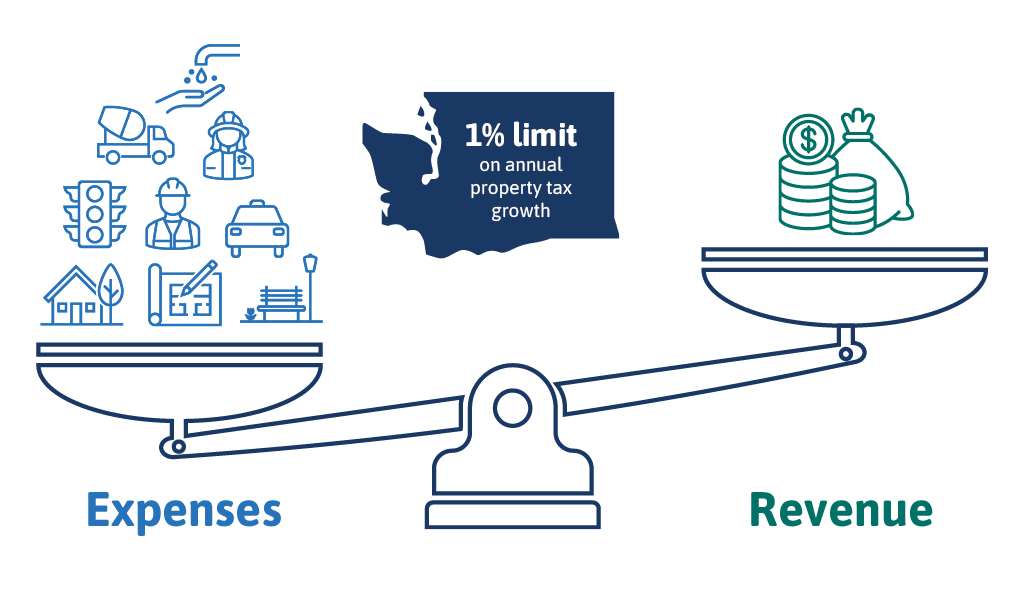
The City’s structural deficit stems from a simple reality: the cost of providing services is rising faster than the revenue the City is allowed to collect. Prices for fuel, equipment, construction materials, and maintenance continue to increase. The City must also offer competitive wages to recruit and retain employees who deliver essential services. Even with careful budgeting, it costs more each year just to maintain current service levels.
Washington state law limits cities to 1 percent annual growth in property tax revenue, regardless of inflation or rising service costs. Because this cap does not keep pace with real-world expenses, it creates an automatic gap between costs and revenue over time.
Closing the projected 2027-2028 deficit
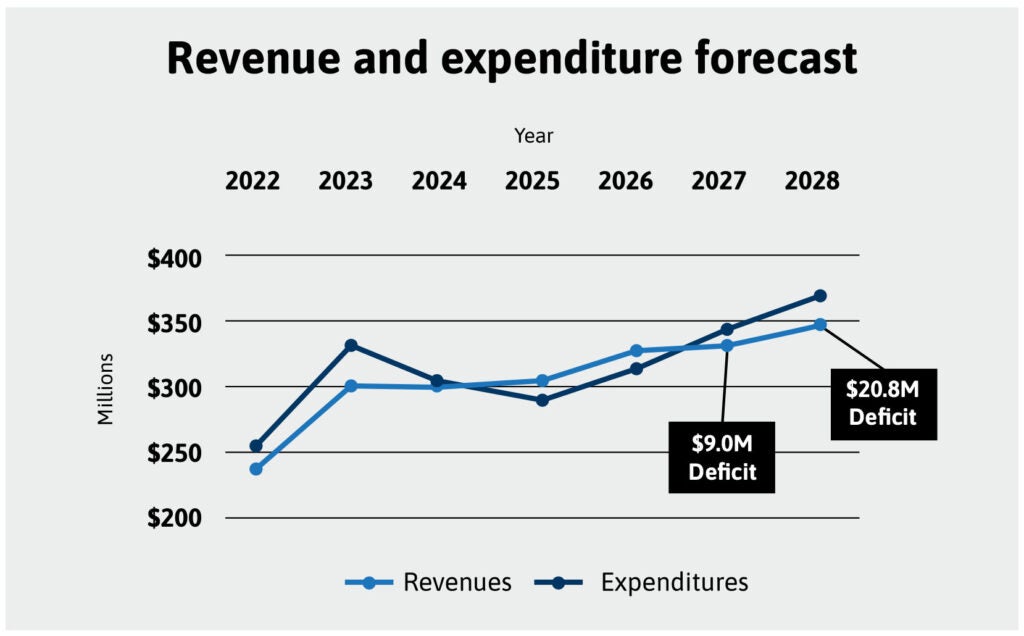
At the budget kick-off, the City projected a $29 million budget gap over the next two years. The City took a deeper look at its financial structure, reviewing longstanding budgeting practices and the assumptions behind them. As of today, this work has made substantial progress towards closing a majority of the deficit for the next biennium.
Identifying solutions to help close the deficit is an important step, but it does not free up additional funding for our ongoing priorities, new initiatives, or the increasing costs of maintaining essential services.